
See what your manufacturing data can become.
For manufacturers operating SAP ECC, SAP S/4HANA, SAP BW, SAP HANA and mixed ERP environments.
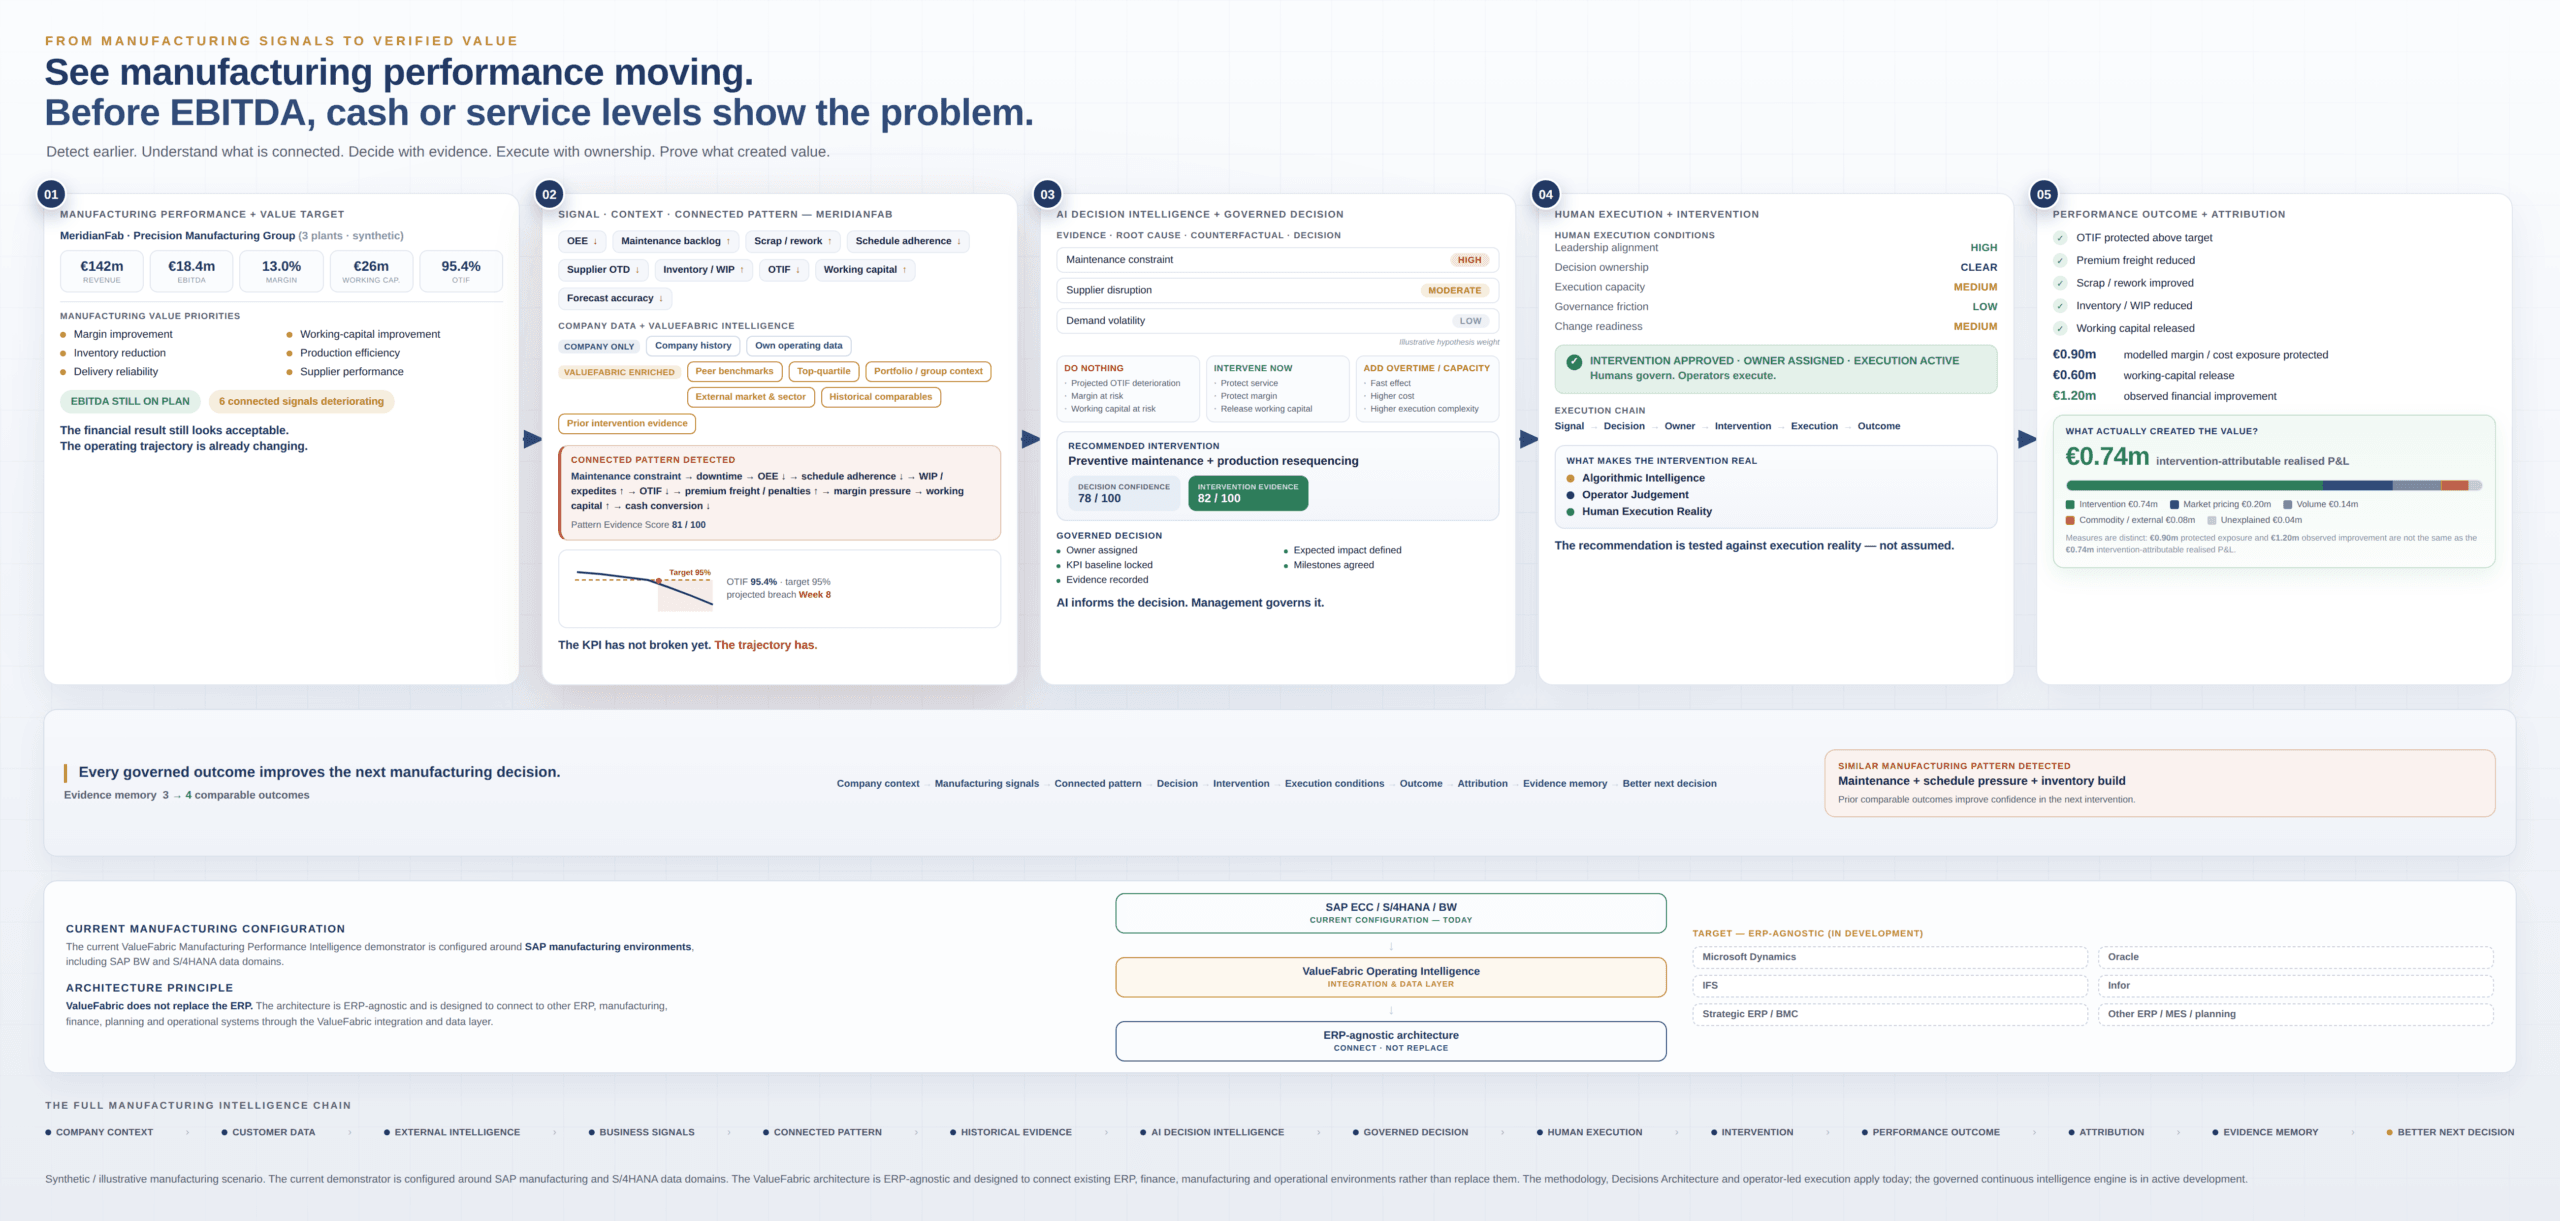
ValueFabric connects financial, operational, commercial and supply-chain data to:
Business Signals → Context & Benchmarks → AI Decision Intelligence → Decisions → Execution → Performance Outcomes → Learning
Not another dashboard.
Not another disconnected AI use case.
A clearer way to see what is changing, understand why it matters, decide where to act and measure what happened next.
Explore:
ENRICHED BUSINESS SIGNALS
Company data interpreted against history, portfolio context, relevant peer benchmarks and external conditions.
CONNECTED PATTERN INTELLIGENCE
See what individual KPIs mean when timing, persistence and relationships are analysed together.
AI DECISION INTELLIGENCE
Explore root-cause hypotheses, counterfactual scenarios, value at risk, intervention ranking and decision confidence.
HUMAN EXECUTION INTELLIGENCE
See why the technically strongest intervention is not always the intervention an organisation can execute successfully.
DECISIONS & OUTCOMES
Connect the selected intervention to accountable ownership, operational results and financial impact
OUTCOME ATTRIBUTION
Separate value created by management intervention from market, volume or other external effects.
ADATIVE EVIDENCE
Complete the loop and see how the outcome strengthens the evidence available for the next comparable decision..
INVESTMENT THESIS TO EXIT
See how plant-level performance evidence connects to EBITDA, cash, working capital, value-creation KPIs and exit readiness.
How You Start
A structured path to Operating Intelligence
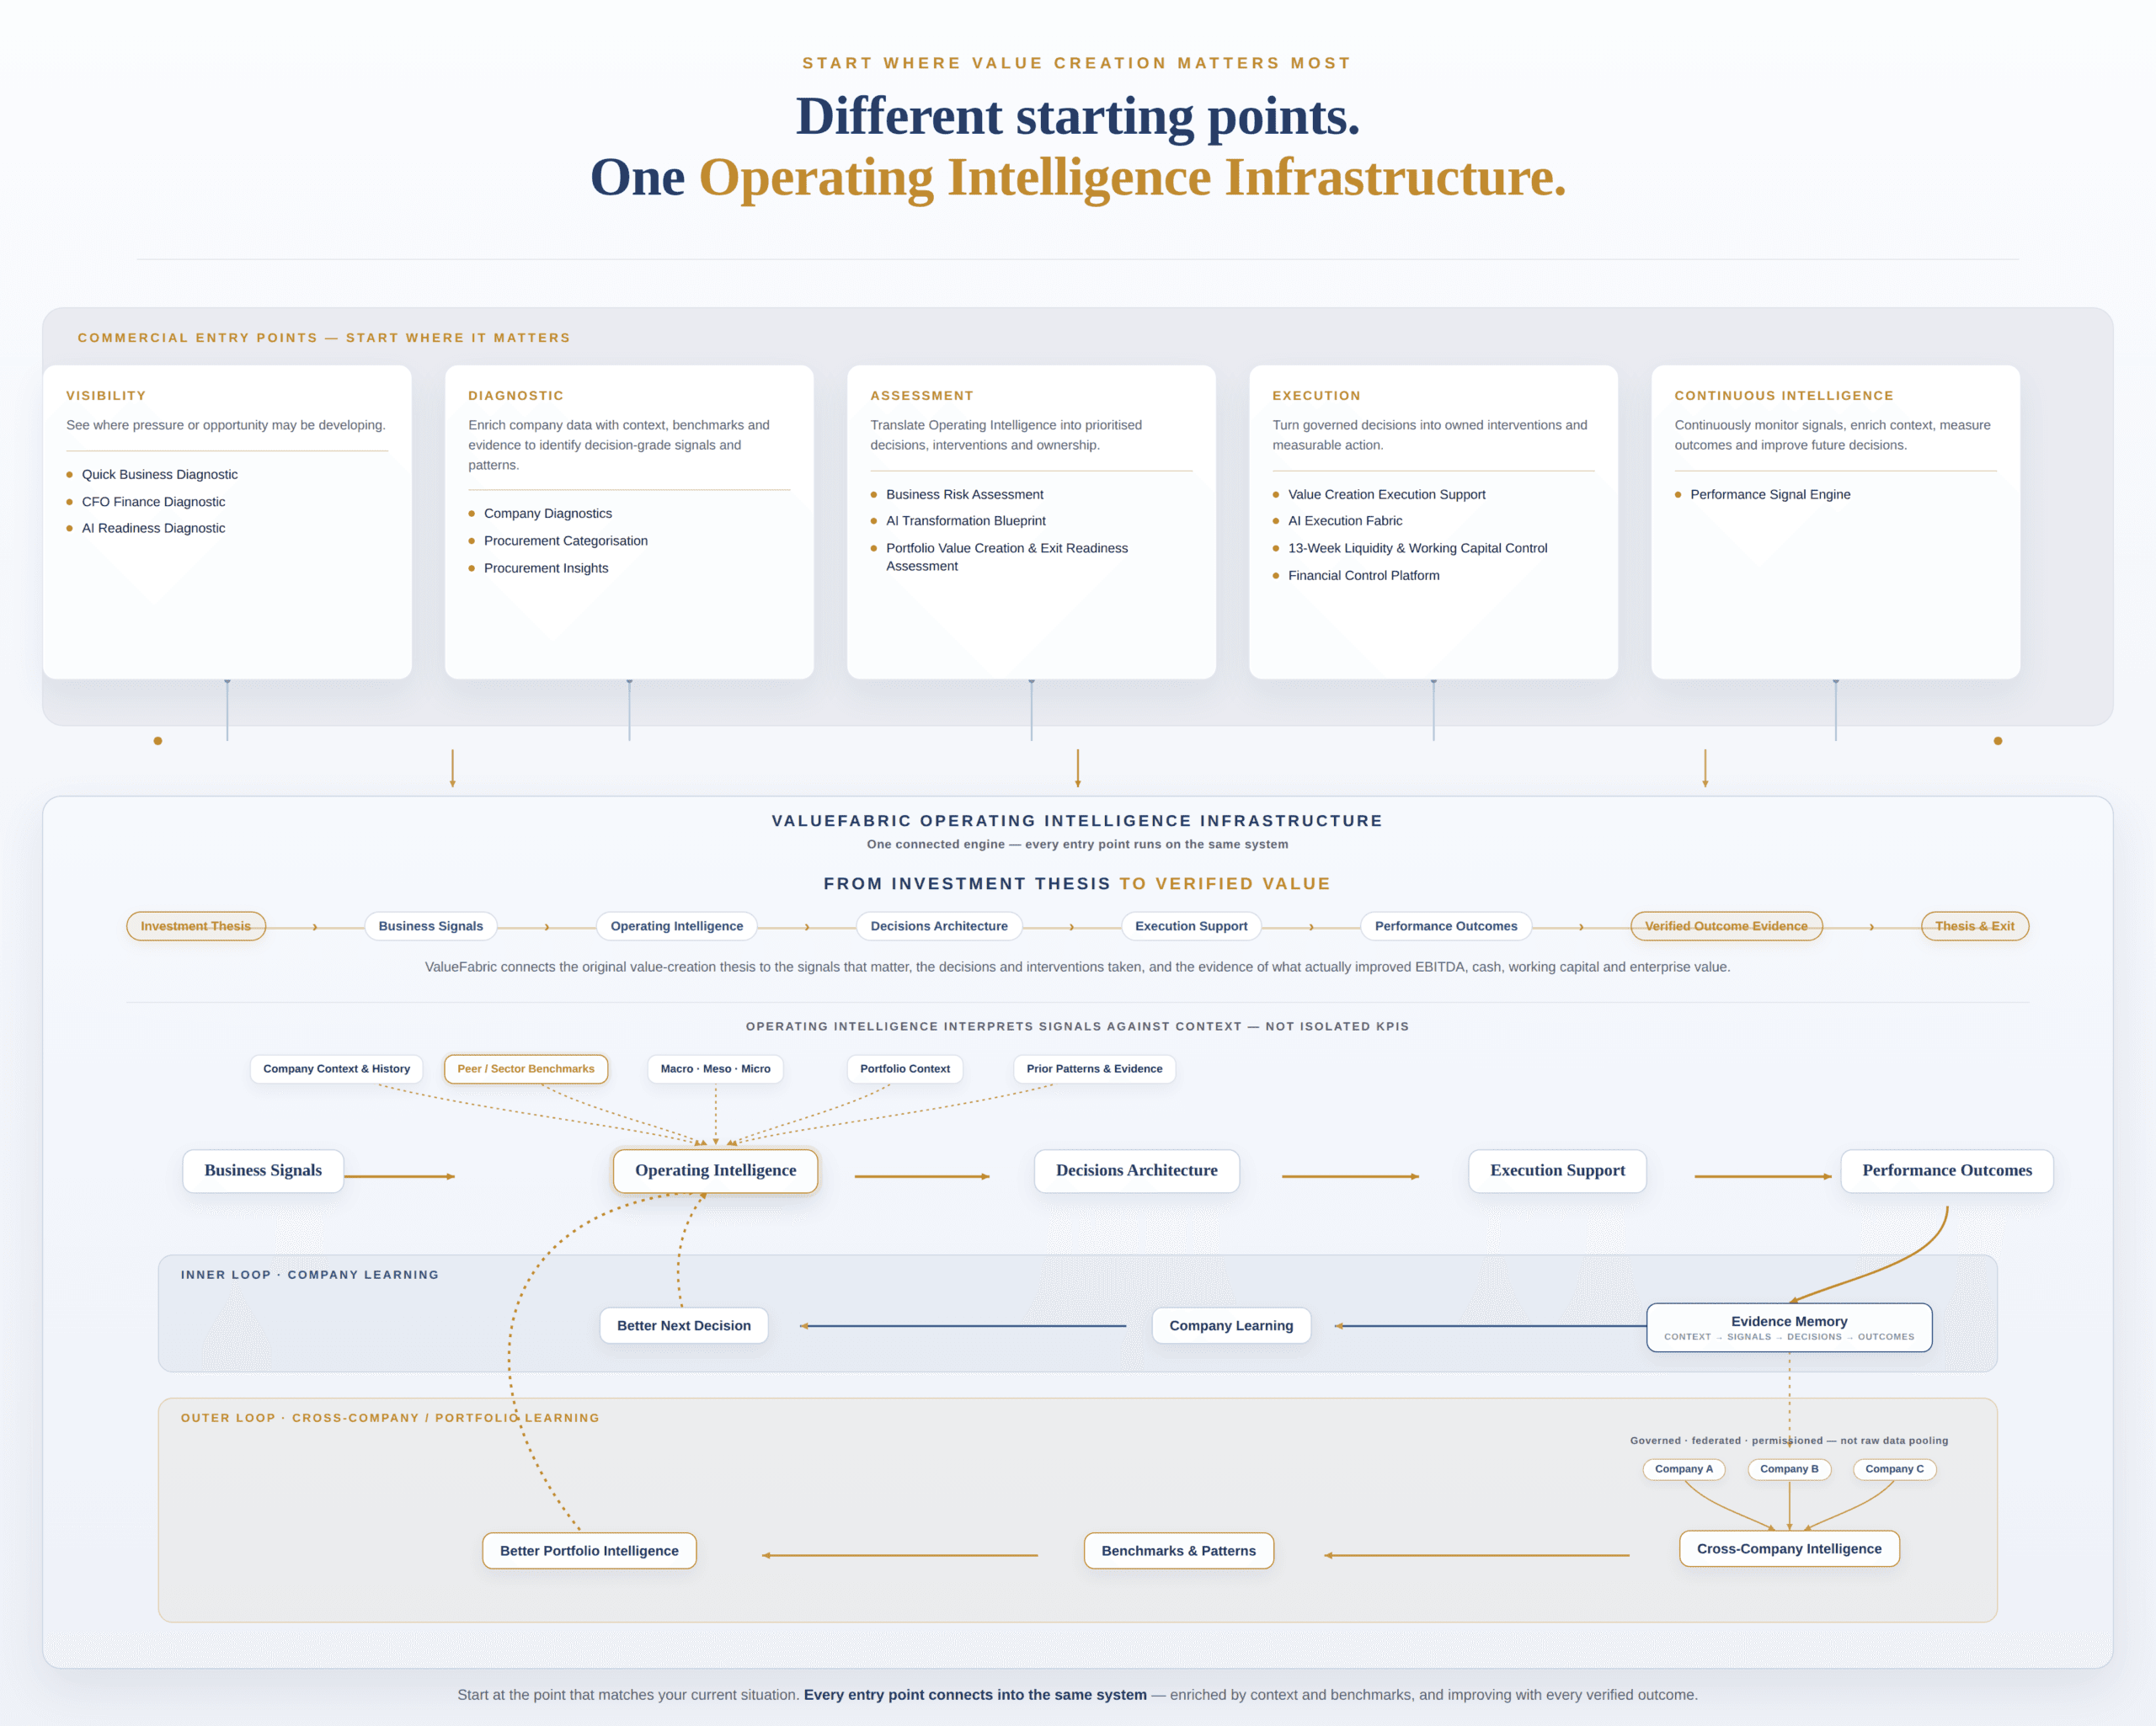
Quick Business Diagnostic
See what your numbers can’t tell you yet – in 10 minutes, for free
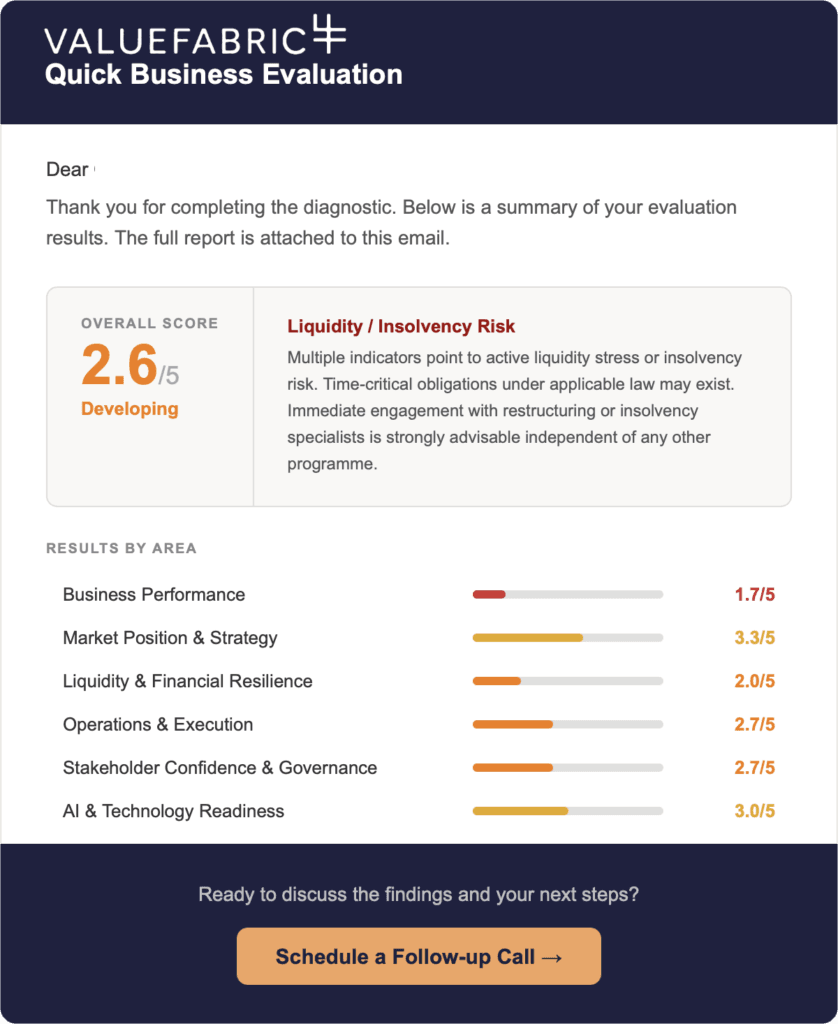
Complete a short online diagnostic designed for CEOs, CFOs, and board executives. Answer structured questions about your organisation. Within 24 hours, you receive a CFO-grade Diagnostic report with your business diagnostic position, peer benchmarks, and a recommended action plan. No cost. No commitment.
What you get:
- 10–15 minute online diagnostic — click-through questions, no documents needed
- CFO-grade report delivered within 24 hours with your intelligence readiness diagnostic
- Peer bench-marking against comparable companies in your sector and geography
- Recommended action plan
45-Minute feedback session
Based on your report, an experienced interim executive from the ValueFabric network walks through your findings in a free 45-minute online session. You discuss where the critical risks are, what’s driving them, and what an improvement strategy looks like. No sales pitch — a genuine strategic conversation about your business.
What you get:
- 45 minute session with a an experienced ValueFabric interim executive
- Detailed walk-through of your individualised report
- A genuine strategic conversation about your business.
- An agreed action plan, tailored to your specific challenges

Business Risk Assessment
Find out where your organisation stands — structured, evidence-based, delivered in 10 days (price range -)
Complete assessment designed for CEOs, CFOs, and board executives.
What you get:
- 10 days assessment, on-site and on-line, data gathering and qualitative interviews
- CFO-grade evidence based report
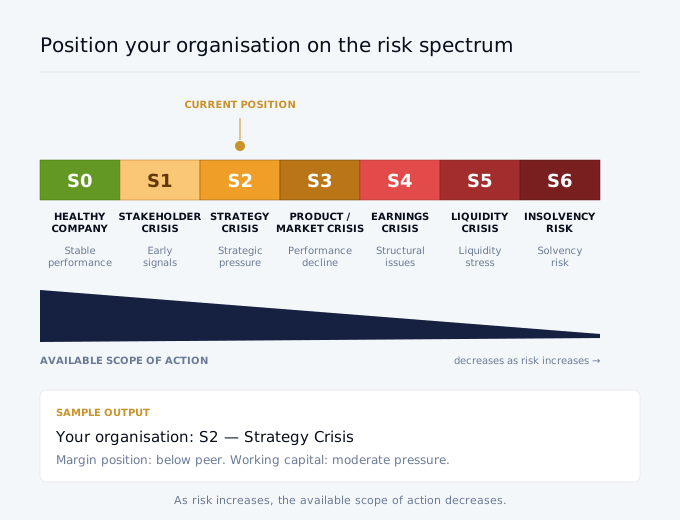
- Your position on the S0–S6 business risk scale (from healthy company to insolvency risk)
- 3 core performance signals assessed: margin position, working capital pressure, and growth quality
- Peer benchmarking against comparable companies in your sector and geography
- Recommended action plan, prioritised risks and a 30–60 day action plan
Expert-led problem solving
See what your numbers can’t tell you yet – in 10 minutes, for free
Our interim CFOs, CEOs, and COOs work inside your organisation to solve the problems the assessment revealed. These are experienced operators — not consultants writing reports. They work hands-on with your leadership team to address margin pressure, operational bottlenecks, working capital issues, and growth challenges.
What you get:
- Experienced, senior, CFOs, CEOs, and COOs working alongside you, inside your organisation
- Direct actions to solve the problems the assessment revealed
- Addressing margin pressure, operational bottlenecks, working capital issues, and growth challenges
- Measurable results

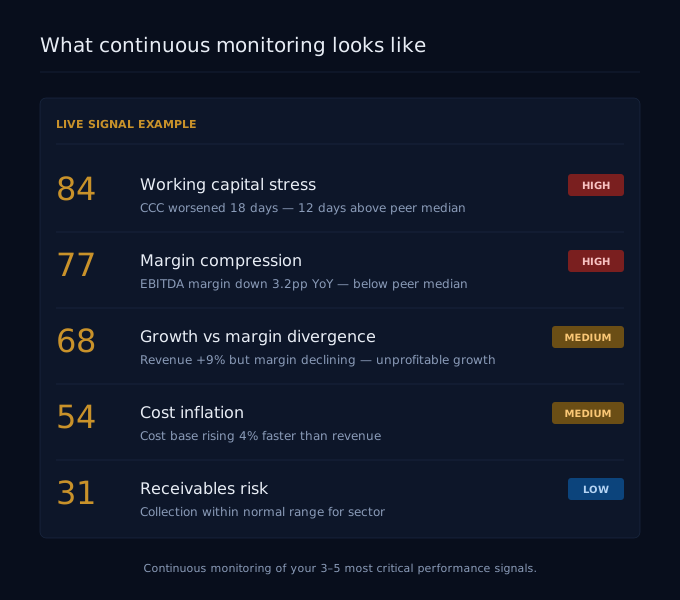
ValueFabric performance signal engine
Once the immediate problems are addressed, the Performance Signal Engine provides continuous monitoring of your company’s performance. It tracks the critical signals identified in your assessment, benchmarks them against sector peers, and alerts your leadership team when patterns shift. It also supports your financial controller with faster quarterly and annual closes — backed by historical and actual data, not manual spreadsheet work.
What it delivers:
- Continuous monitoring of your 3–5 most critical performance signals
- Peer benchmarking against comparable companies in your sector
- Early warning when margin, cash flow, or operational patterns deteriorate
- Faster quarterly and annual closing with evidence-based reporting
- Historical and actual data connected — replacing manual analysis
Your data. Enriched by ValueFabric.
Your SAP environment already holds much of the operating evidence.
ValueFabric adds context around it.
Customer data
Financial
Operational
Commercial
Production
Supply Chian
Procurement
Planning
Forecasting
Inventory
Cash
ValueFabric Intelligence
Company history
External market and sector context
Permissioned portfolio intelligence
Relevant peer benchmarks
Historical performance patterns
Intervention evidence
Human execution conditions
Performance Outcomes
Better Management Decisions
The objective is not simply to know that a KPI moved.
The objective is to understand:
- Is it abnormal?
- Is it company-specific or externally driven?
- Which signals are connected?
- What happens if we do nothing?
- Which intervention has the strongest evidence?
- Can the organisation execute it?
- What value is at risk?
- Did the intervention actually work?
Choose your next experience
You do not need to start with a platform implementation.
Start with the business problem.
MANUFACTURING CFO SIGNAL REVIEW
Find the dominant signal.
A focused executive review across areas such as:
Margin
Cash
Working capital
Inventory
Supplier cost
Forecast accuracy
Revenue quality
Operational bottlenecks
Financial and planning visibility
The review identifies which signals require management attention and which next capability is relevant.
13-WEEK LIQUIDITY & WORKING CAPITAL CONTROL
See cash pressure before options become limited.
A CFO-controlled rolling view of:
Weekly cash
Liquidity headroom
Receivables
Payables
Inventory
Working capital
Forecast versus actual
Funding requirements
Decision triggers
Management actions
Start with a complimentary two-hour 13-Week Liquidity Working Session against your own cash position.
COMPANY & PROCUREMENT DIAGNOSTIC
Turn company and spend data into decision-ready evidence.
Company Diagnostics
Financial health
Performance risks
Peer and sector comparison
Value-creation opportunities
Prioritised actions
Procurement Categorisation & Insights
Supplier and category visibility
Spend structure
Supplier concentration
Cost pressure
Savings opportunities
Working-capital implications
The diagnostic is the starting point.
The findings can be translated into Business Signals, decision questions, intervention priorities and measurable Performance Outcomes.
CONTINUOUS FP&A
Connect the financial plan to what is actually happening in the business.
Where forecasting, planning or reporting is the core problem, Continuous FP&A can connect:
Rolling forecasts
Budgets
Scenarios
Actual versus plan
Operational drivers
Financial drivers
Variance analysis
Forecast confidence
Management actions
Where Dynac is deployed, Dynac provides the Continuous FP&A and finance-planning backbone while ValueFabric adds diagnostics, Business Signals, Decisions Architecture, execution support and Operating Intelligence.
MANUFACTURING VALUE CREATION MASTERCLASS
Experience the method before applying it to your company.
One day. One generic manufacturing case. Three signals you may not be connecting.
Work through:
Business Signal Pattern Intelligence
Connected-signal intelligence
Intervention Outcome Learning
Decisions Architecture
Performance Outcome evidence
No confidential company data is required.
Learn the method on a representative manufacturing case.
Then apply it to your own company through the Manufacturing Value Creation Program.
MANUFACTURING VALUE CREATION PROGRAM
Apply the complete operating model to your company.
The Program uses your own:
SAP and operating data
Financial data
KPIs
Manufacturing constraints
Management capacity
Ownership reality
Value-creation priorities
The working logic is:
DETECT → INTERPRET → DECIDE → EXECUTE → MEASURE → LEARN → PROVE
Potential outputs include:
Manufacturing Signal Architecture
EBITDA & Margin Quality Bridge
Inventory, WIP & Cash Early-Warning Map
Demand, Forecast & Revenue Quality Map
Connected Throughput & Constraint Map
Manufacturing Intervention Prioritisation Matrix
100-Day Decision & Execution Architecture
SAP, FP&A & AI Deployment Plan
Verified Manufacturing Value Creation & Evidence Pack
Continuous Manufacturing Intelligence Roadmap
From plant performance to enterprise value.
Manufacturing performance does not stop at the plant.
Demand → Capacity → Production → Constraints → Inventory → Delivery → Margin → Working Capital → Cash → Enterprise Value
ValueFabric connects the operating movement to the management decision and then to the financial outcome.
That is the bridge between operational improvement and measurable value creation.
For Private Equity & Investors
Apply the same intelligence across the portfolio.
For PE firms, Operating Partners, Family Offices and portfolio value-creation teams, the same operating chain can extend beyond one manufacturing company.
Identify where portfolio value is at risk.
Prioritise where intervention is required.
Connect the investment thesis to Business Signals.
Track decisions and execution.
Measure EBITDA, cash and working-capital outcomes.
Build stronger evidence for boards, lenders, quality-of-earnings reviews and exit.
What makes the intelligence compound
A benchmark tells you where you differ. A forecast tells you where you may be heading. A recommendation tells you what someone thinks you should do.
ValueFabric is building the connection between all of them:
Company Context
Business Signal
Benchmarks & External Intelligence
Connected Patterns
Decisions
Interventions
Human Execution Conditions
Operational & Financial Outcomes
GOVERNED OUTCOME EVIDENCE → BETTER EVIDENCE FOR THE NEXT COMPARABLE DECISION
Models can be copied. Dashboards can be bought.
The harder asset to replicate is a governed history connecting what happened, what management decided, what was executed, under which conditions, and what measurable outcome followed.
That history has to be built over time
Built together with our ecosystem partners
ValueFabric connects specialist technology, data and executive capabilities into a single Operating Intelligence architecture.



Build around the environment you already have
SAP does not need to be replaced.
Neither does your existing planning, manufacturing or operational stack.
ValueFabric is designed to operate above the existing systems of record and connect their information to management decisions and measurable outcomes.
Relevant environments can include:
SAP ECC
SAP S/4HANA
SAP BW / BW4HANA
SAP HANA
SAP manufacturing applications
ERP
CRM
Excel
FP&A systems
Manufacturing systems
Data platforms
External and research data
These systems provide the data.
ValueFabric provides the Operating Intelligence layer.
Experience first.
You do not need to start with a long transformation discussion.
Want to see the intelligence?
Want to see it against your own company?
Need immediate cash visibility?
Want to identify where value is leaking?
Want to experience the methodology first?
Ready to build the complete value-creation plan?
Manufactruing Performance Intelligence.
See earlier.
Understand the context.
Compare the evidence.
Decide where to act.
Execute with ownership.
Measure the outcome.
Improve the next decision.